Ever Notice That the Hockey Stick and the Long Tail are the Same Data Looked Inversely?
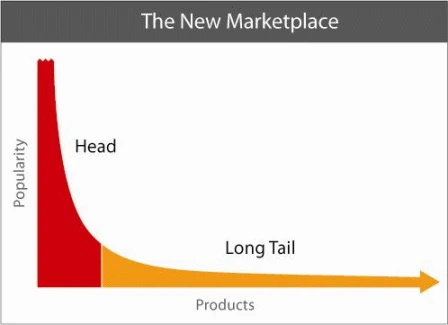
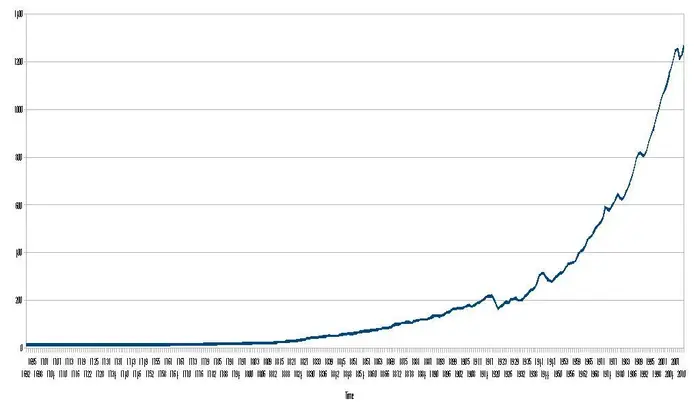
Most every entrepreneur “wants” to show the growth chart as a “hockey stick”. They also in the initial days show their revenue adoption as a “long tail”.
Take the same data and pivot the table to show they are both really the same visualization. Flip the long tail on its X axis and you get the hockey stick.